Sewage Generation
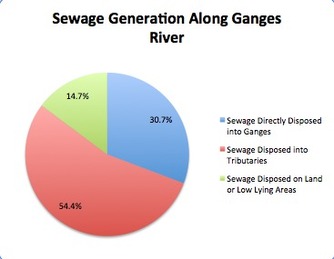
The total waste water generation from 222 towns in Ganges basin is 8,250 million liters daily (MLD). Of the 8,250 MLD, 2,538 MLD (30.7%) is directly discharged into the Ganges River, 4,491 MLD (54.4%) is disposed into tributaries of river Ganges, and 1,220 MLD (14.7%) is disposed on land or low lying areas.
A large cause for concern is the 4,491 mld (54.4%) of the total sewage generation is being disposed of in the tributaries is that these tributaries are the main source of water flow for the river. As previously stated,even if 100% of the waste is treated, the water quality of the river without adequate flow will not meet the minimum criteria for bathing. Bathing is one of the main uses for the river and if the faecal coliform levels are above what is permissible, the likelihood of people catching waterborne illnesses from bathing in the river are increased.
Ganga Action Plan
In attempt to counteract pollution and save The Ganges River, the government enacted the Ganga Action Plan (GAP) in 1985. Out of the 35 sewage treatment plants (STPs) under GAP phase I, 29 are functioning but just because they are functioning does not mean they are functioning properly or at full capacity.
Plants are both over loaded and under loaded. This means that some treatment plants are over designed and have a capacity that extremely exceeds the amount necessary (under loaded). Some of these under loaded treatment plants are only operating at 25% of the installed capacity. Others are under designed and do not come close to meeting the capacity necessary for that given area. Many of the plants are treating the water through biological processes and when they are overloaded it will completely spoil the performance of the plant by killing off the bacterial populations that cannot handle the amount of pollution. These treatment plants that are overloaded and cannot treat the needs of the town and send the untreated water back to the Ganges River.
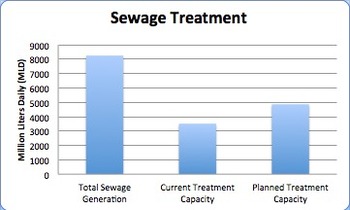
The bar graph below shows that the total sewage generation of the river is at 8,250 million liters daily (MLD) and in the current treatment plan (Phase I) of the GAP, 3,513 MLD are being treated. With the implementation of Phase II of the GAP, the planned treatment of sewage is projected to treat another 1,350 MLD on top of the 3,513 MLD that is already being treated, totaling to 4,863 MLD being treated out of the 8,250 MLD that is being dumped into the river. This does not match or exceed the sewage generation and still renders the water quality unsafe and leaves 3,387 MLD untreated.
Where does the treated water go?
26 towns have treatment facilities that were set up by the GAP to treat domestic sewage. 16 of these towns with the sewage treatment plants are using the treated water for irrigation purposes and pisciculture (breeding, catching, and rearing of fish under controlled conditions). With water not being returned to the river, the flow will decrease resulting in a decrease of water quality because the river loses it's ability to clean itself.
In attempt to counteract pollution and save The Ganges River, the government enacted the Ganga Action Plan (GAP) in 1985. Out of the 35 sewage treatment plants (STPs) under GAP phase I, 29 are functioning but just because they are functioning does not mean they are functioning properly or at full capacity.
Plants are both over loaded and under loaded. This means that some treatment plants are over designed and have a capacity that extremely exceeds the amount necessary (under loaded). Some of these under loaded treatment plants are only operating at 25% of the installed capacity. Others are under designed and do not come close to meeting the capacity necessary for that given area. Many of the plants are treating the water through biological processes and when they are overloaded it will completely spoil the performance of the plant by killing off the bacterial populations that cannot handle the amount of pollution. These treatment plants that are overloaded and cannot treat the needs of the town and send the untreated water back to the Ganges River.
The bar graph below shows that the total sewage generation of the river is at 8,250 million liters daily (MLD) and in the current treatment plan (Phase I) of the GAP, 3,513 MLD are being treated. With the implementation of Phase II of the GAP, the planned treatment of sewage is projected to treat another 1,350 MLD on top of the 3,513 MLD that is already being treated, totaling to 4,863 MLD being treated out of the 8,250 MLD that is being dumped into the river. This does not match or exceed the sewage generation and still renders the water quality unsafe and leaves 3,387 MLD untreated.
Where does the treated water go?
26 towns have treatment facilities that were set up by the GAP to treat domestic sewage. 16 of these towns with the sewage treatment plants are using the treated water for irrigation purposes and pisciculture (breeding, catching, and rearing of fish under controlled conditions). With water not being returned to the river, the flow will decrease resulting in a decrease of water quality because the river loses it's ability to clean itself.
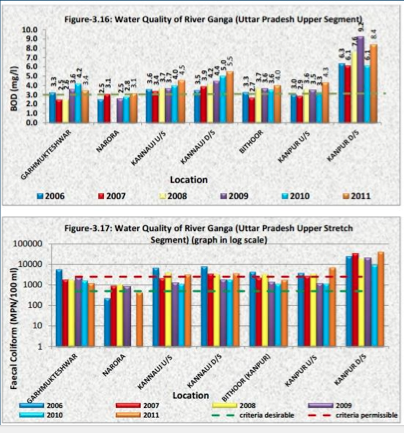
We chose to focus on the Uttar Pradesh Upper Segment of the River Ganges because we saw this segment as being a representation of the whole. BOD levels show an increasing trend since 2006. Fecal coliform levels are steadily marked above the level desirable for bathing, with few sites exceeding the levels permissible for bathing. Though the levels are most all above that desirable, there is a small decreasing trend in fecal coliform levels. This, however, does not mean that Indian efforts to clean the river are effective. The river remains highly polluted and dangerous.
